
 Germany
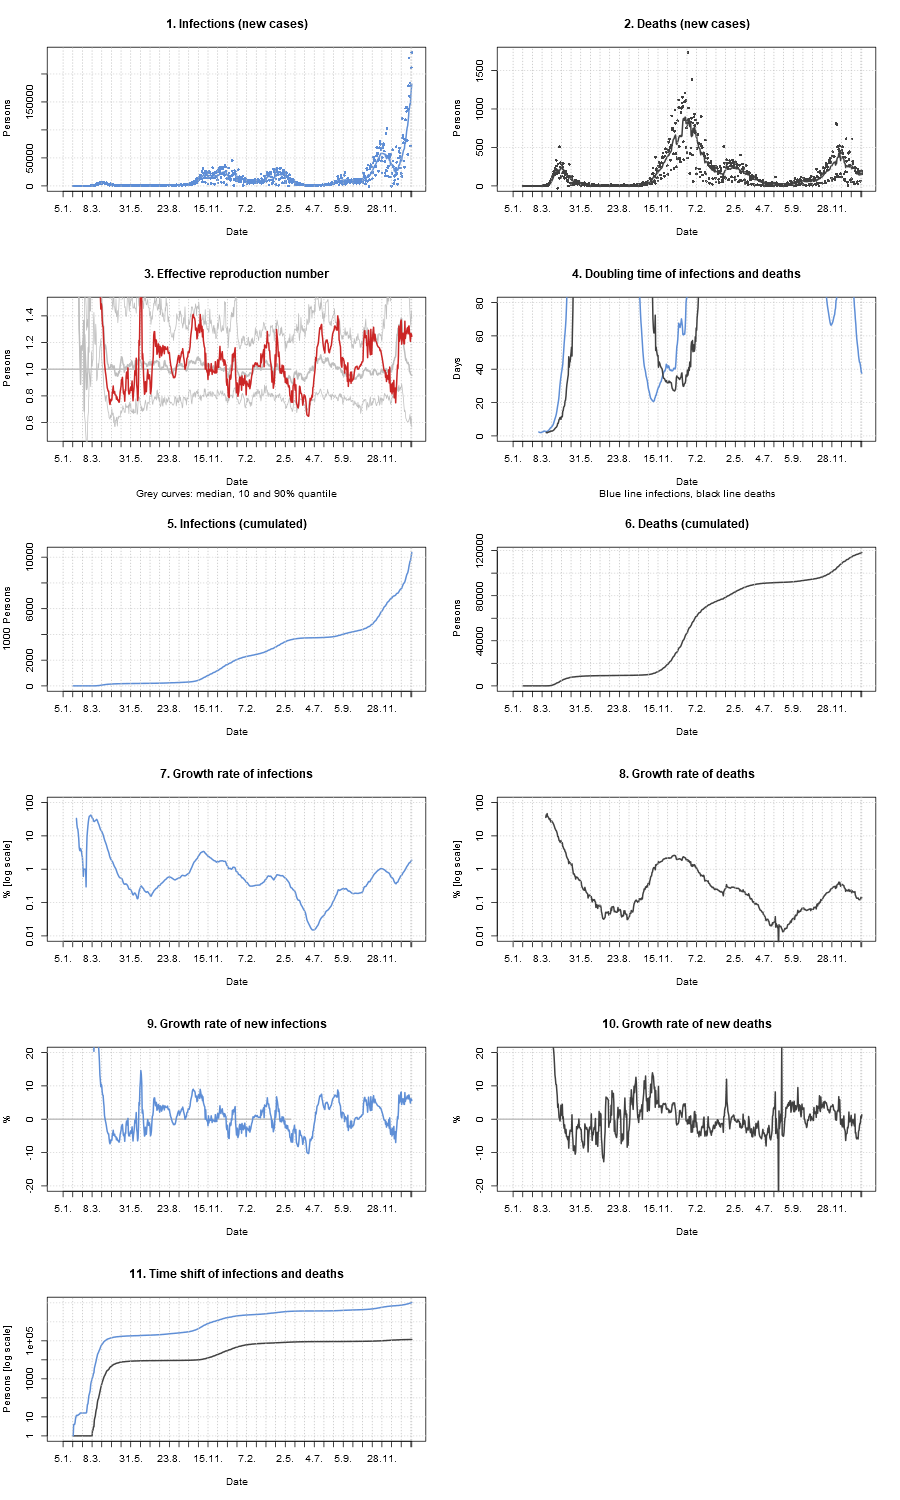
Source of raw data: Hannah Ritchie et al., https://ourworldindata.org/covid-cases, csv-file
The map is based on the free NASA file Equirectangular-projection.jpg
All curves of the new cases (infections and deaths) represent a moving average of 7 days.
Estimation for the latest 3 days is based on a linear trend function.
To reduce a week day influence all growth rates are geometric means of the weekly growth.
Calculation of the reproduction number assumes a generation time of 4 days.
Switch to the interactive corona analysis and forecasting tool.